The price-earnings ratio (P/E ratio) is literally the ratio between the price and earnings of stocks. This is a classic tool to determine whether a stock or group of stocks (such as an index) is expensive or cheap. Instead of using profit forecasts (that is to say guesswork) or profits for the past year, the cyclically adjusted P/E ratio (or CAPE) uses the average profits over the past ten years. The idea is that such a figure gives a good idea of what profits are over an economic cycle (growth + recession).
The red dotted line of the figure below shows the annualized real return over fifteen years for the S&P 500 (the latest figures available are for September 2000 to August 2015). The blue solid line corresponds to the CAPE (the scale is inverted, so if the curve rises the CAPE decreases). The CAPE is fairly well correlated with real gains over the next fifteen years. When the CAPE is very high (when the shares are overvalued) future performance is poor. And when the CAPE is very low (shares are cheap) performance over the period that follows is above average. The CAPE was above 30 for three months in 1929, and we all know what happened next. It even exceeded 40 from January 1999 to September 2000!
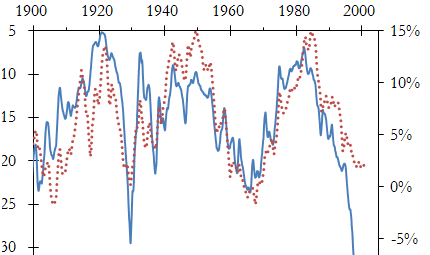
Figure 1: The annualized real return on equity over fifteen years (dotted line, right scale) and the CAPE (solid line, left inverted scale) as functions of time.
The figure below shows the annualized real return on the following twenty years depending on the CAPE value at the time (each circle corresponds to one month). When the CAPE was below 10 the return of the S&P 500 has never been less than 5% per year over the twenty years that followed (that is to say, stocks multiplied their purchasing power by at least 2.6), and it has never been above 8% per year when the CAPE was above 20. (That does not necessarily mean that it will never happen, just that it is not likely.)
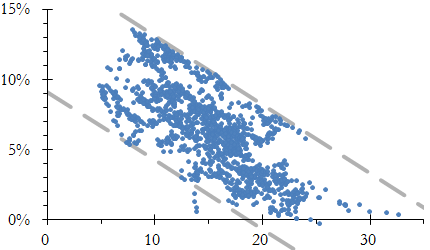
Figure 2: The annualized gains of purchasing power of stocks over the next twenty years as a function of the CAPE value.
The CAPE value dropped from nearly 45 in 1999–2000 to 21 in early 2003 to go back up to a little over 25 between 2004 and 2007. It then dropped below 14 in early 2009. Knowing that the historical average for the CAPE for the S&P 500 is 16.5 (median at 16), over the last twenty-five years it was below its historical average for less than a year. The US stock market was so overvalued that prices have not dropped from expensive to cheap, but from very expensive in 1999–2000 to merely expensive in 2003, and only in 2009 was the market reasonably affordable.
The CAPE for the S&P 500 is currently around 25. One can therefore expect a real return over the next twenty years of less than 6% p.a. This implies that it is very unlikely that performance be at the historical average of 6–7% of annual purchasing power gain. Note that other markets (e.g. in Europe) can have lower CAPE values.
