If you may need your money at any time then you keep it all in a savings account. If, on the other hand, you have decades ahead of you (e.g. for retirement), you invest mostly in equity. These are rather simple decisions to make. But what about intermediate time scales: what stock allocation over five or ten years? Intuitively, one would expect that the equity allocation will be higher than for short-term savings and lower than the long term case, but it is unclear whether the glass is half empty or half full.
Figure 1 shows all possible combinations of stocks, bonds and cash in 10% increments. For every allocation, the red, middle bar is the median gain of purchasing power, i.e. the value such that half the outcomes will be above and half below this value. The blue bar, on the left, is the downside risk: there is a 5% probability of doing worse than this value. Conversely the green bar is the upside, with 1 chance out of 20 of doing better. (See http://mathieu.bouville.name/en/finance/articles/investing-risk_return.pdf to find out more about the methodology used.)

Fig. 1: The median and the top and bottom 5% of gains (after inflation) over 100 000 euros invested for 2 years (a), 5 years (b) and 10 years (c). Darker bars have been truncated. [Enlarge figure]
For instance, over two years a 100 000 euro investment in cash would be as likely to yield more than 2000 € after inflation as less than 2000 €. There is a 5% probability of losing a few hundred euros of purchasing power (due to an interest rate lower than inflation), and as much chance of getting 4000 €. The bars for current accounts (checking accounts) show that the risk with investment portfolios is not necessarily greater than the erosion of one's purchasing power through inflation.
Figure 2 represents the downside as a function of the median gain for the allocations shown in Fig. 1. It shows that different allocations with the same median return can have different levels of risk, and allocations that have the same downside can have different medians. For instance a pure bond portfolio has a median gain of 36 000 € over 10 years and a 5% probability of losing about 14 700 €. A portfolio with 60% stocks and 40% bonds has a similar (in fact slightly more favorable) downside risk but a median return of over 62 000 €. And a portfolio made of 30% stocks, 30% bonds and 40% cash has a median 3000 € higher than bonds but a 5% downside of only −1700 €. (See the three open triangles in Fig. 2.) The bond portfolio is therefore a bad choice of investment: it is possible to have a higher return for the same downside, or the same return and a lower risk.
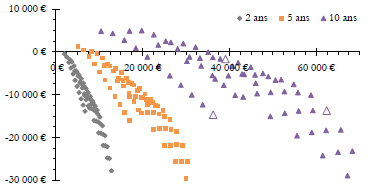
Fig. 2: The bottom 5% as a function of the median gain (both after inflation) for an investment of 100 000 €.
Only allocations along the top right of Fig. 2 can be of interest to investors. If you can find an investment that yields more than your current portfolio without more risk, then your current allocation is bad. (Finance is pretty straightforward sometimes.) Going from an inefficient allocation to an efficient one is a way to eat your cake and still have it. It is not so common to have an opportunity to get free money, so do not overlook it.
An investor who cares only about the possibility of growth would seek to maximize the average or median return. But most investors do care about the downside of their investments, so they look for a trade-off between return and risk. The solid purple line in Fig. 1 corresponds to the median plus the downside: a riskier portfolio is then deemed better if it improves the median return more than it worsens the downside. The maximum of the line indicates the optimal allocation according to this criterion. The general trend is, as expected, that more conservative portfolios fare better over two years (the line goes down) but are inadequate over ten years. The dashed blue line gives more weight to the downside and thus favors more conservative portfolios (this is especially visible over five years).
More generally, one can try to maximize the sum of the median and the downside multiplied by a prudence coefficient. Figure 1 showed results for prudence coefficient values of 1 (solid purple line) and 2 (dashed blue line). Figure 3 shows the best stock allocation as a function of the prudence coefficient. A value of zero corresponds to risk neutrality: only the median gain counts, not the downside; this naturally leads to investing only in stocks. When one wishes to be more prudent, the stock allocation decreases (sometimes dramatically). For a two-year horizon, one generally invests nearly purely in cash; but there should be an equity allocation (if only a few percents). Over thirty years, on the other hand, even the most conservative portfolios should be at least about half in equity and hold no cash.
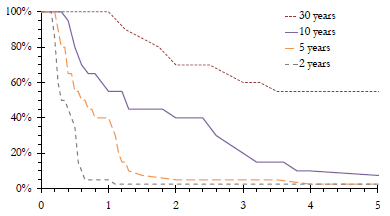
Fig. 3: The optimal equity allocation as a function of the prudence coefficient.
One can remark that the prudence coefficient makes it possible to compare portfolios with different time horizons. Is a 80–20 stock–bond portfolio meant for 30 years more or less conservative than a five-year portfolio with 50% cash, 30% bonds and 20% stocks? The former is optimal for prudence coefficients between 1.5 and 1.75, whereas the latter corresponds to 1.15–1.2. So, quite surprisingly, the portfolio half in cash is less conservative than the investment with 80% equity.
Figure 4 shows that the set of optimal allocations does not change between two and thirty years: either stock–bond portfolios with 40–100% equity or stock–bond–cash with 50% more bonds than stocks. Note, in particular, that bonds are never optimal by themselves: their maximum allocation is 60%. What changes is the prudence coefficient corresponding to each portfolio, and the fact that the portfolios with more cash are never optimal over long periods.
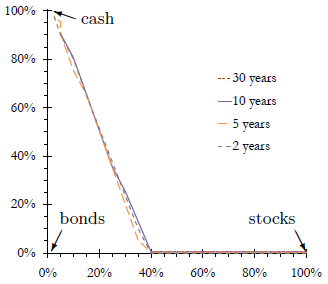
Fig. 4: Cash allocation as a function of stock allocation, optimal for prudence coefficients decreasing from left to right.
Figure 5 shows some of the allocations that may be optimal. It shows even more clearly than Fig. 1 that, over two years, riskier investments have much lower downsides without much higher medians. And over ten years, on the other hand, below 30–40% equity the risk does not grow very fast with the stock allocation, but the median does go up substantially.
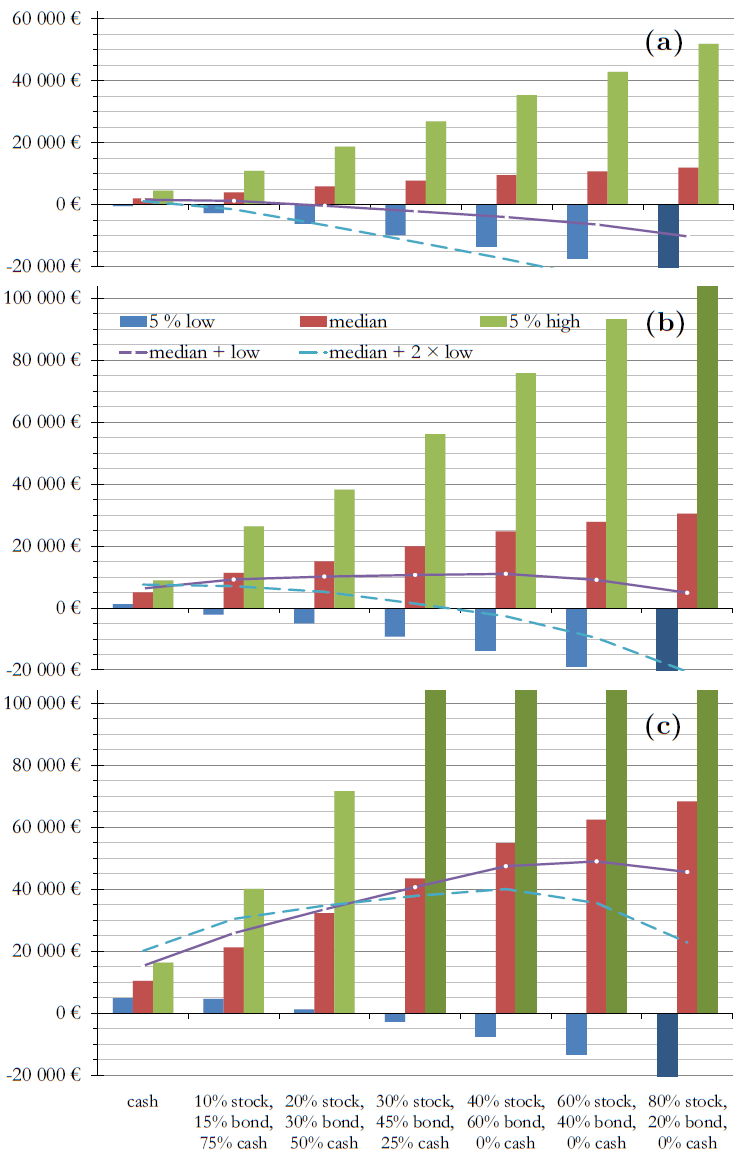
Fig. 5: The median and the top and bottom 5% of gains (after inflation) over 100 000 € invested for 2 years (a), 5 years (b) and 10 years (c). Darker bars have been truncated. [Enlarge figure]
For two-year investments, adding 10% equity or fixed income to a cash holding increases the scale of the downside. Whereas over ten years adding 10% stocks to a cash holding raises the median gain without decreasing the downside: more money without more risk (bearing in mind that a more extreme risk, e.g. something happening 1% of the time, may still worsen with more equity). In the short term adding stocks to a portfolio mostly adds to the risk, whereas in the long term, it mostly adds to the return. For long enough time horizons, holding stocks can make portfolios less risky.
The choice between a portfolio with higher risk and higher return potential and a portfolio with lower risk and lower return (i.e. the choice of prudence coefficient) is a personal one. But, whatever one does, one must be careful to choose a portfolio that is optimal: one should accept more risk only for the potential of a higher return.
