New: More complete, more up to date (and somewhat more technical) version
The claim that the stock market is an investment for the long term is very common, but also very vague. When exactly does the long term start? Is five years long term? or do you have to wait for twenty years? or perhaps thirty years is what it really takes. Banks and fund managers talk of things like minimum investment time horizon, claiming for instance that a stock investment has to be at least five years. Does it mean that investing one's money is essentially risk-free provided that the investment lasts at least five years?
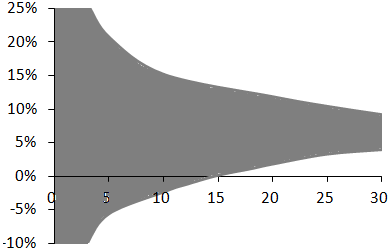
Figure 1: 90% of annual real returns are in the grey area.
The numbers I will use for stocks correspond to:
Figure 1 shows that the uncertainty of returns decreases as the investment duration increases. Over five years there is a 90% probability for the return to be between −6% and +20% p.a. Over thirty years, the range narrows down to a 4–9% annual gain of purchasing power. But the figure shows that this reduction is steady: there is no cut-off investment duration separating a "long term" clearly from the "short term".
Figure 2 shows that the risk of losing purchasing power goes down when investment duration increases. If one invests in stocks for two years the odds of losing money are one in four, but only one in twenty over fifteen years.
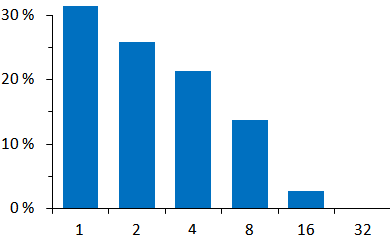
Figure 2: Probability of real loss for a stock investment as a function of the investment length in years.
Looking more closely, Fig. 2 shows three regimes. Between one and eight years the probability of real loss decreases slowly, then it drops faster. After that, it is very small (over the past century and a half, there was no period longer than twenty years that led to a real loss for a stock investment). The figure has only six different values; but if one were to look at more possible time lengths (and I did) one could see that the rapid drop takes place between twelve and seventeen years. After seventeen years the probability is nearly zero, so it cannot go further down. So, in order to study investments beyond seventeen years, a different criterion is needed.
The average real gain increases steadily with the length of investment. But one does not always get the average. Figure 3 shows losses that have a 5% probability of occurring; for instance over ten years there is a one in twenty odd of losing a bit more than $2 000 on an initial investment of $10 000. One sees clearly that over two to twelve years, there is a non-negligible risk of a real loss. Despite what one may believe, twelve years is not long term.
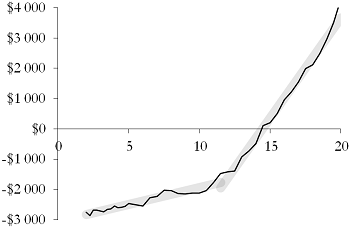
Figure 3: 5% risk of purchasing power gains for a $10 000 stock investment as a function of the investment length in years.
Over the longer term, there is little risk of losing money. In fact, over thirty years, there is a 5% risk of only tripling your purchasing power; this kind of risk is not too scary... In particular, Fig. 3 shows that after a dozen years the 5% risk improves quickly. (Fitting power laws on a shifted curve —to avoid negative values— instead of using linear regressions gives a cut-off of ten years.)
So when does the long term start? If we consider that the long term corresponds to bad news being about lower gains rather than bigger losses, then the long term does not start before a dozen years. This does not mean that twelve years are enough to get the full benefits of long-term investments, but rather that shorter investments are sure not to get them.
When exactly does the long term starts? One possible answer is that the long term begins when one can invest right before a stock market crash and not lose money anyway.
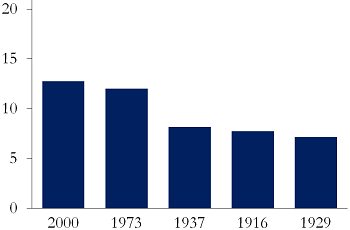
If you invested in 2000 at the market peak, you had to wait until 2013 to recover your investment. Investing in 1973, you had to wait for twelve years too for your investment to grow back to its initial value. Figure 4(a) shows how long it took to first recover from the worst market crashes in US history. After 2000 and 1973 it took a dozen years, but for all others (including 1929) a bit more than a half-dozen years was enough.
 |
 |
|
Figure 4(a): How many years it took to first recover one's capital after the worst market crashes. |
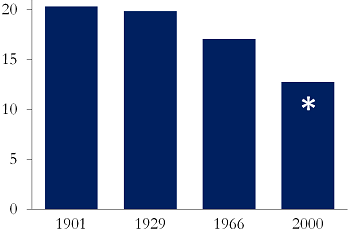
Figure 4(b): How many years it took to permanently recover one's capital after the worst market crashes. |
Except that once the initial investment has been recovered it can be lost again in a subsequent crash. It was the case for instance during the 2000 decade: the crash of 2000–2001 was followed by another major fall in 2008. The money recovered after the former was lost again in the latter.
Figure 4(b) shows how long it took for the market to permanently recover after the worst crashes, i.e. never fall back again below the initial value. (Note that it may take more than 13 years to recover from the 2000 crash if the market were to lose another 20% compared to the lows of August 2015 — hence the asterisk.) The worst cases were the crashes of 1901 and 1929, after which one had to wait for twenty years to permanently revover one's initial capital. Historically, if you waited for twenty years, you never lost money even if you were unlucky enough to invest at the peak of a bubble.
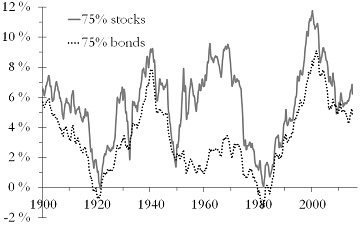
Figure 5(a) shows the annual returns of stock-heavy (solid line) and bond-heavy (dotted line) stock–bond portfolios invested for twenty years. However you split your investment between stocks and bonds during the periods 1900–1920 (shown as 1920 in the figure), 1930–1950 or 1960–1980, you made no money — stock-heavy investments barely maintained purchasing power, and bond-heavy ones often lost some. However you invested during the periods 1880–1900, 1920–1940 or 1980–2000, you could only win. Plainly, over twenty years, asset allocation is not nearly as important as timing. That is to say: when investing over twenty years, making sensible decisions matters less than being born at the right time.
 |
 |
|
Figure 5(a): Over twenty years, asset allocation is not nearly as important as timing. |
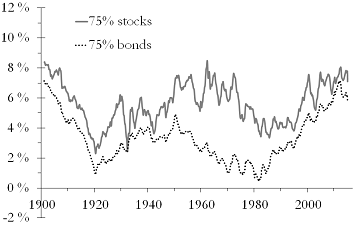
Figure 5(b): Over thirty years, asset allocation matters. |
Over thirty years, however, asset allocation is important, as shown by Fig. 5(b). A portfolio three-quarters in stocks returned between about 2.5% and 8.5% p.a. over thirty years, against 0–12% over twenty years. The uncertainty due to the start date is much smaller. In this respect, even twenty years cannot be deemed to be long term. A twenty-year investment depends more on timing (which cannot be controlled) than on asset allocation (which can be).
All criteria argue for a long term not starting before a dozen years, with some putting the transition around seventeen or twenty years. And Fig. 5 indicates that it can even take more than twenty years to see substantial changes in the qualitative behavior of the investments.
The myth that a stock investment needs ten years is busted. The long term starts at fifteen or twenty years — and one can easily argue it takes even longer.
